Sarah B Moore

I turn your data to life with clear insights, meaningful analytics, visual stories, and creative solutions.

Case Studies

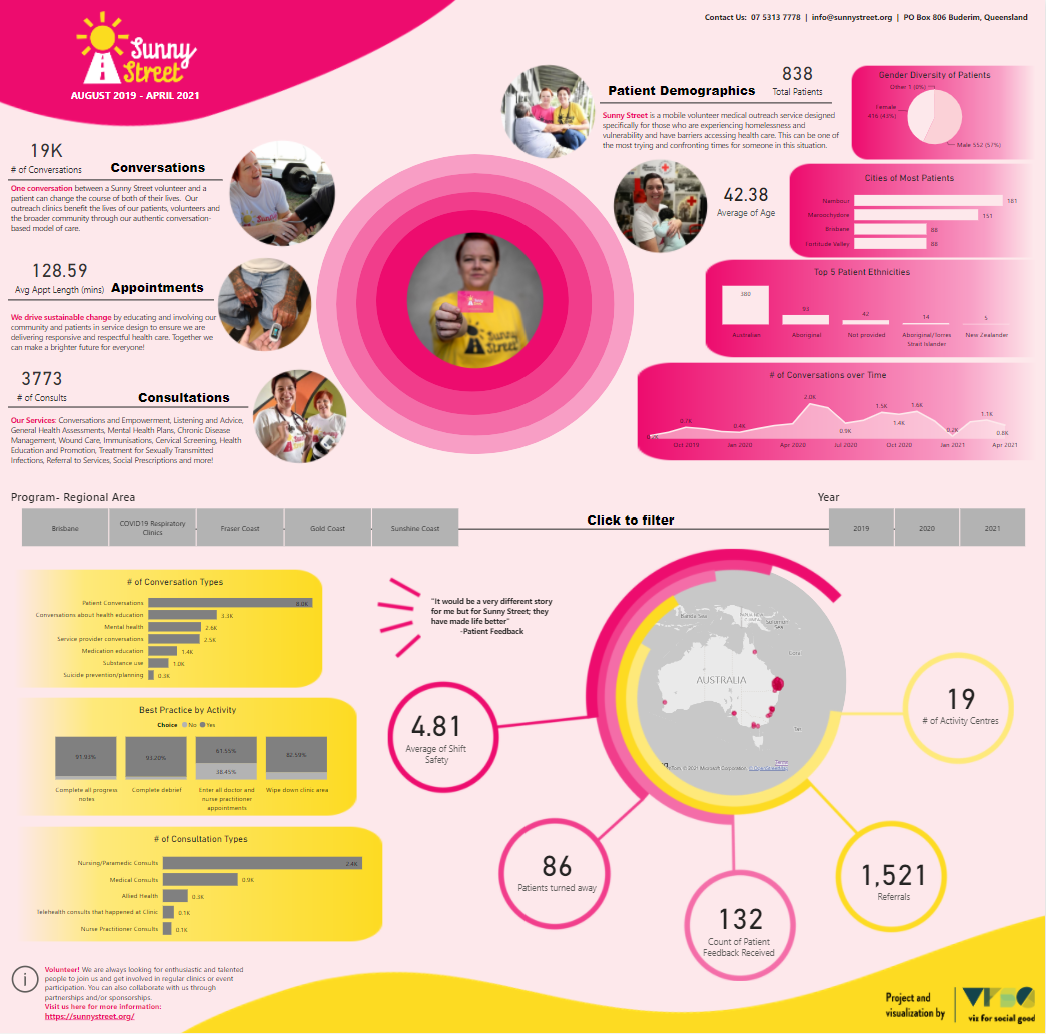
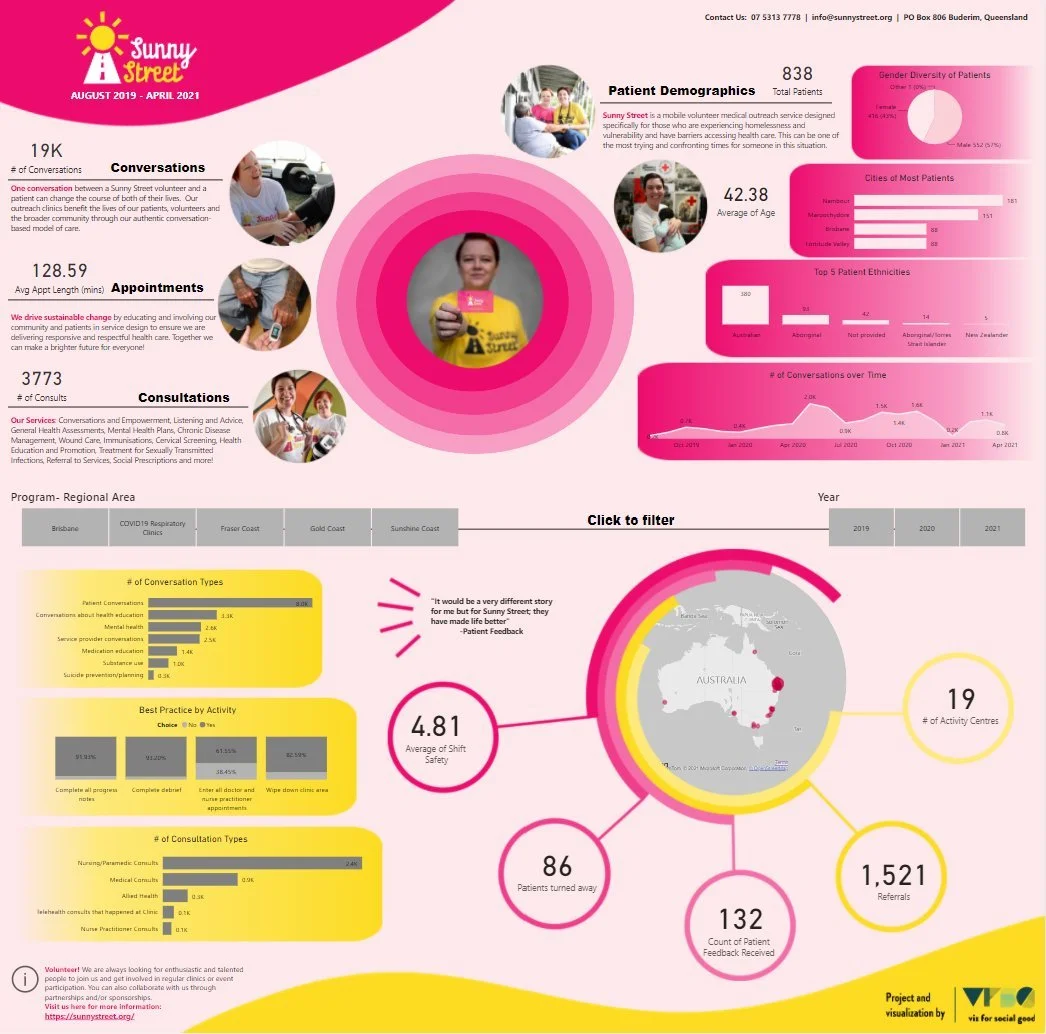
Sunny Street

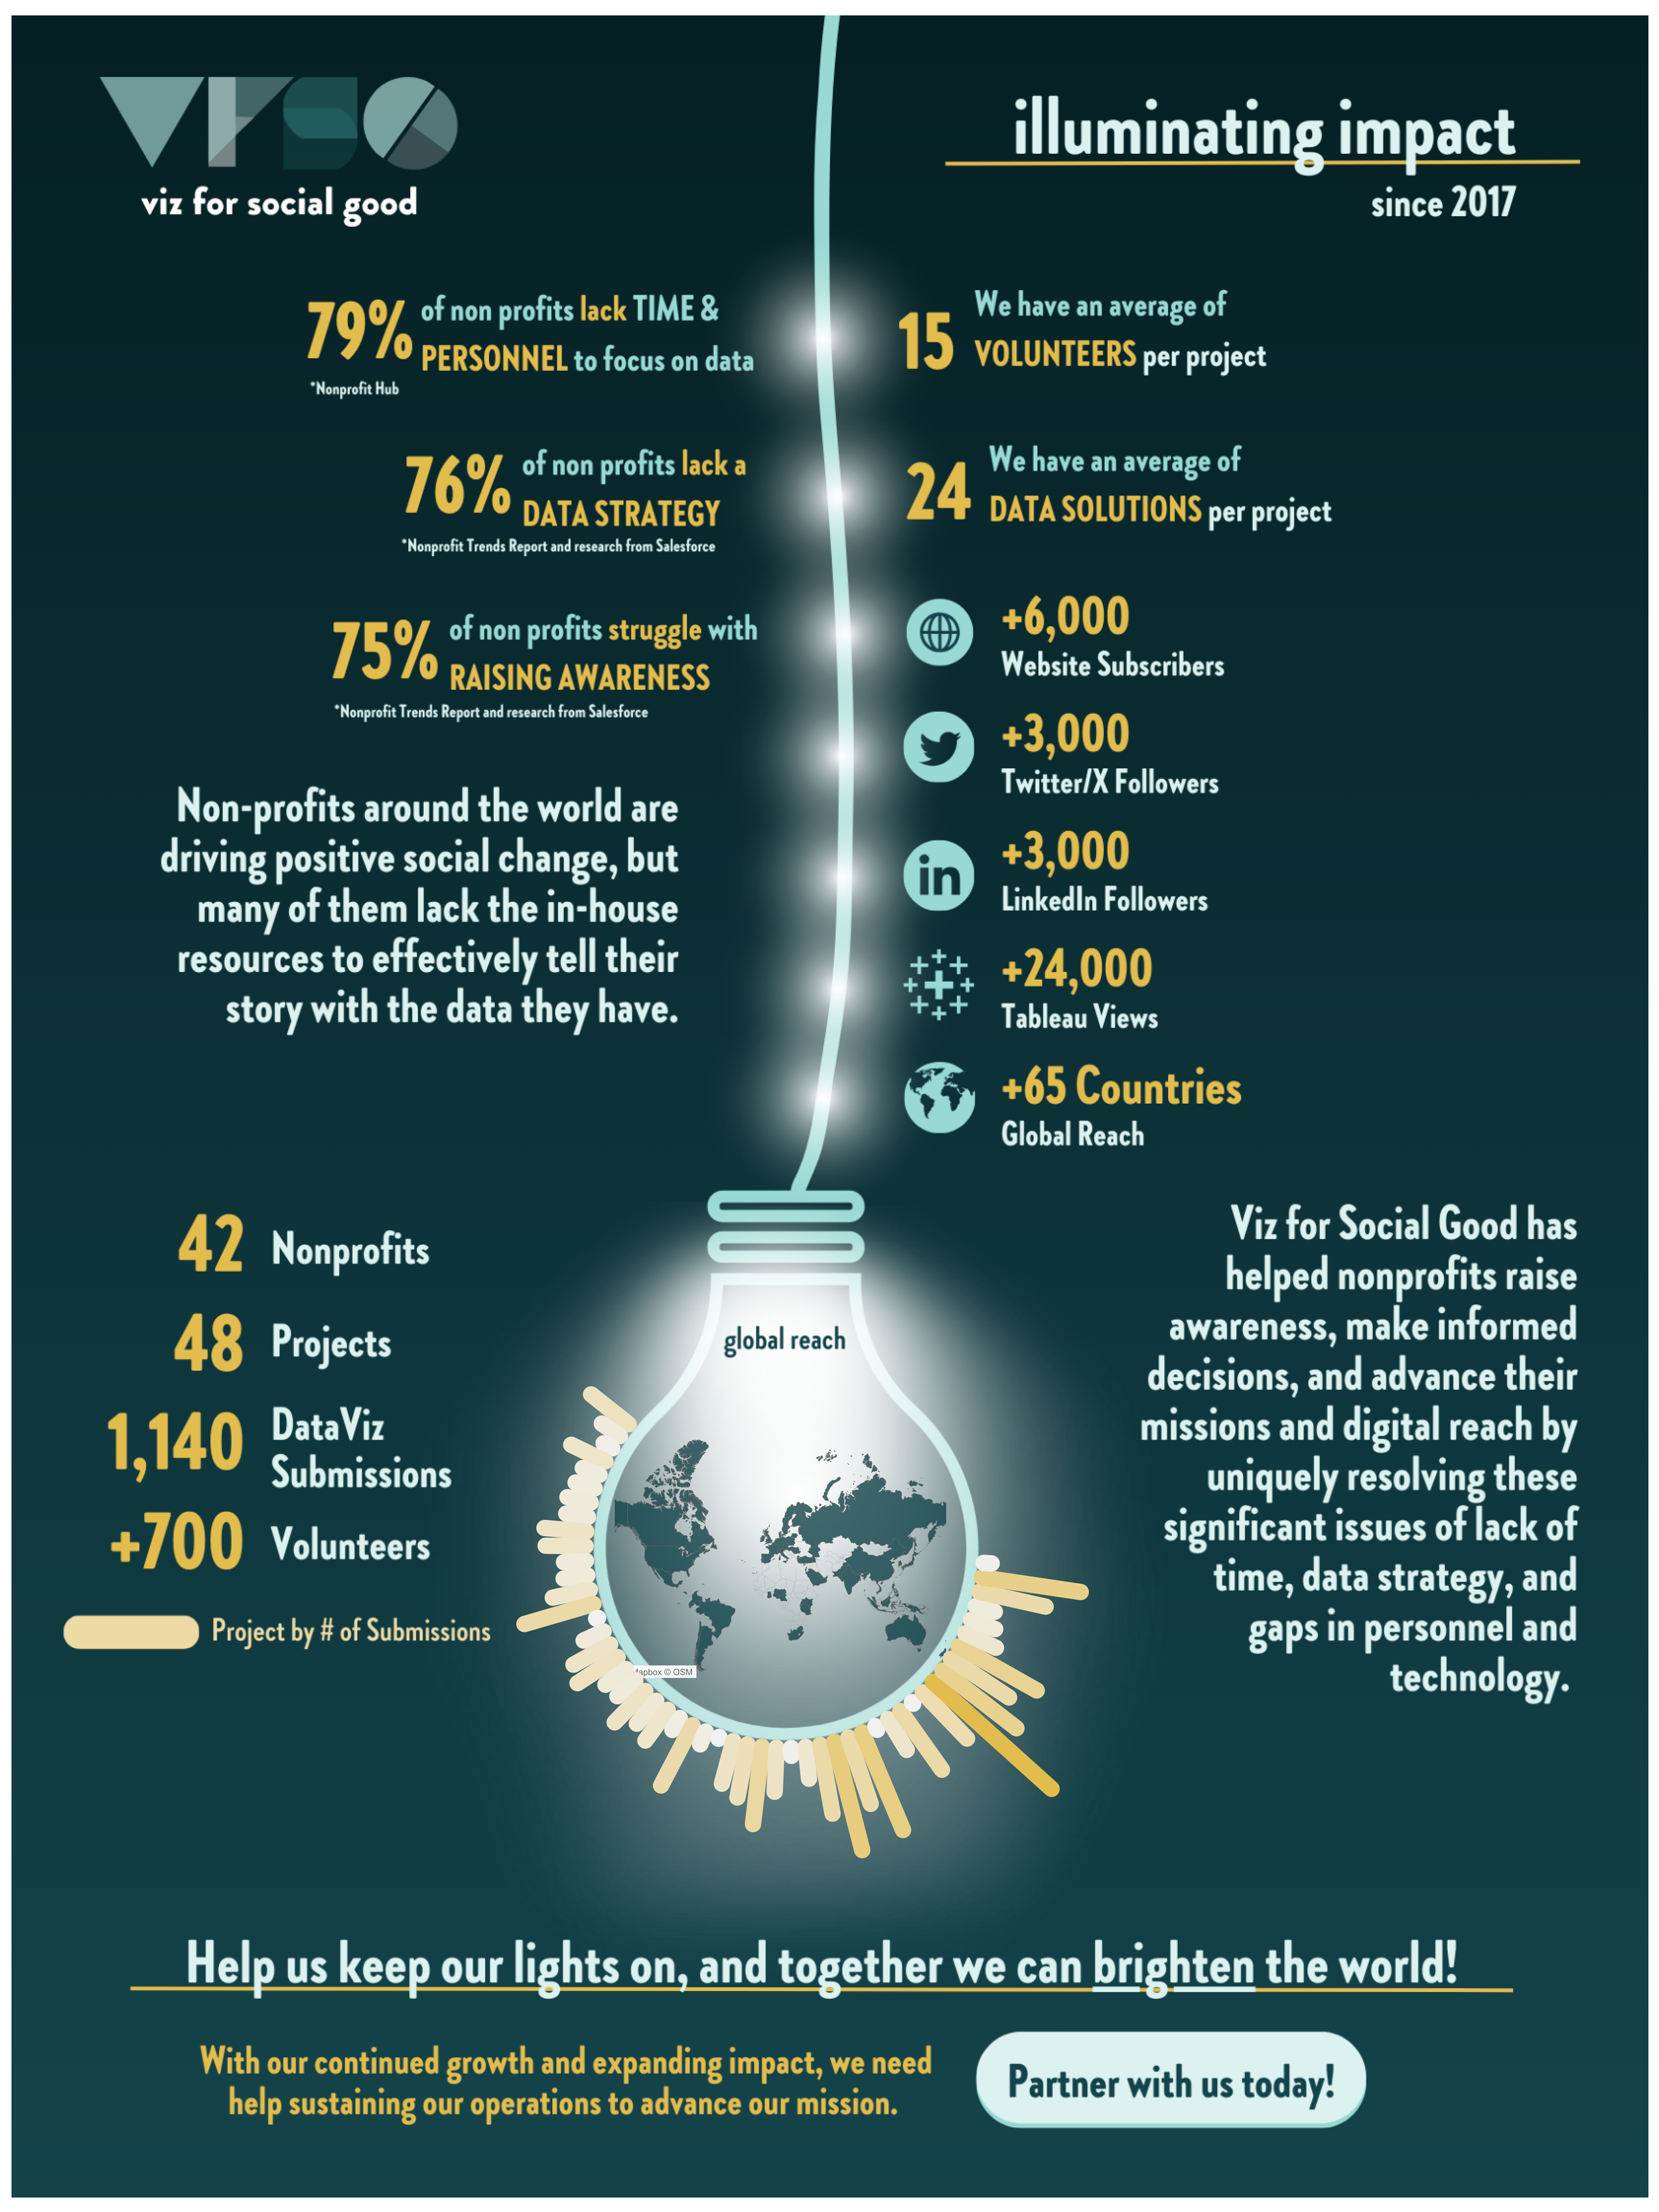
Sunny Street is leveraging three years of data to analyze the impact of their services, particularly post-COVID-19, and using visual representations of this data to secure grants, engage stakeholders, and communicate their social impact through various platforms.

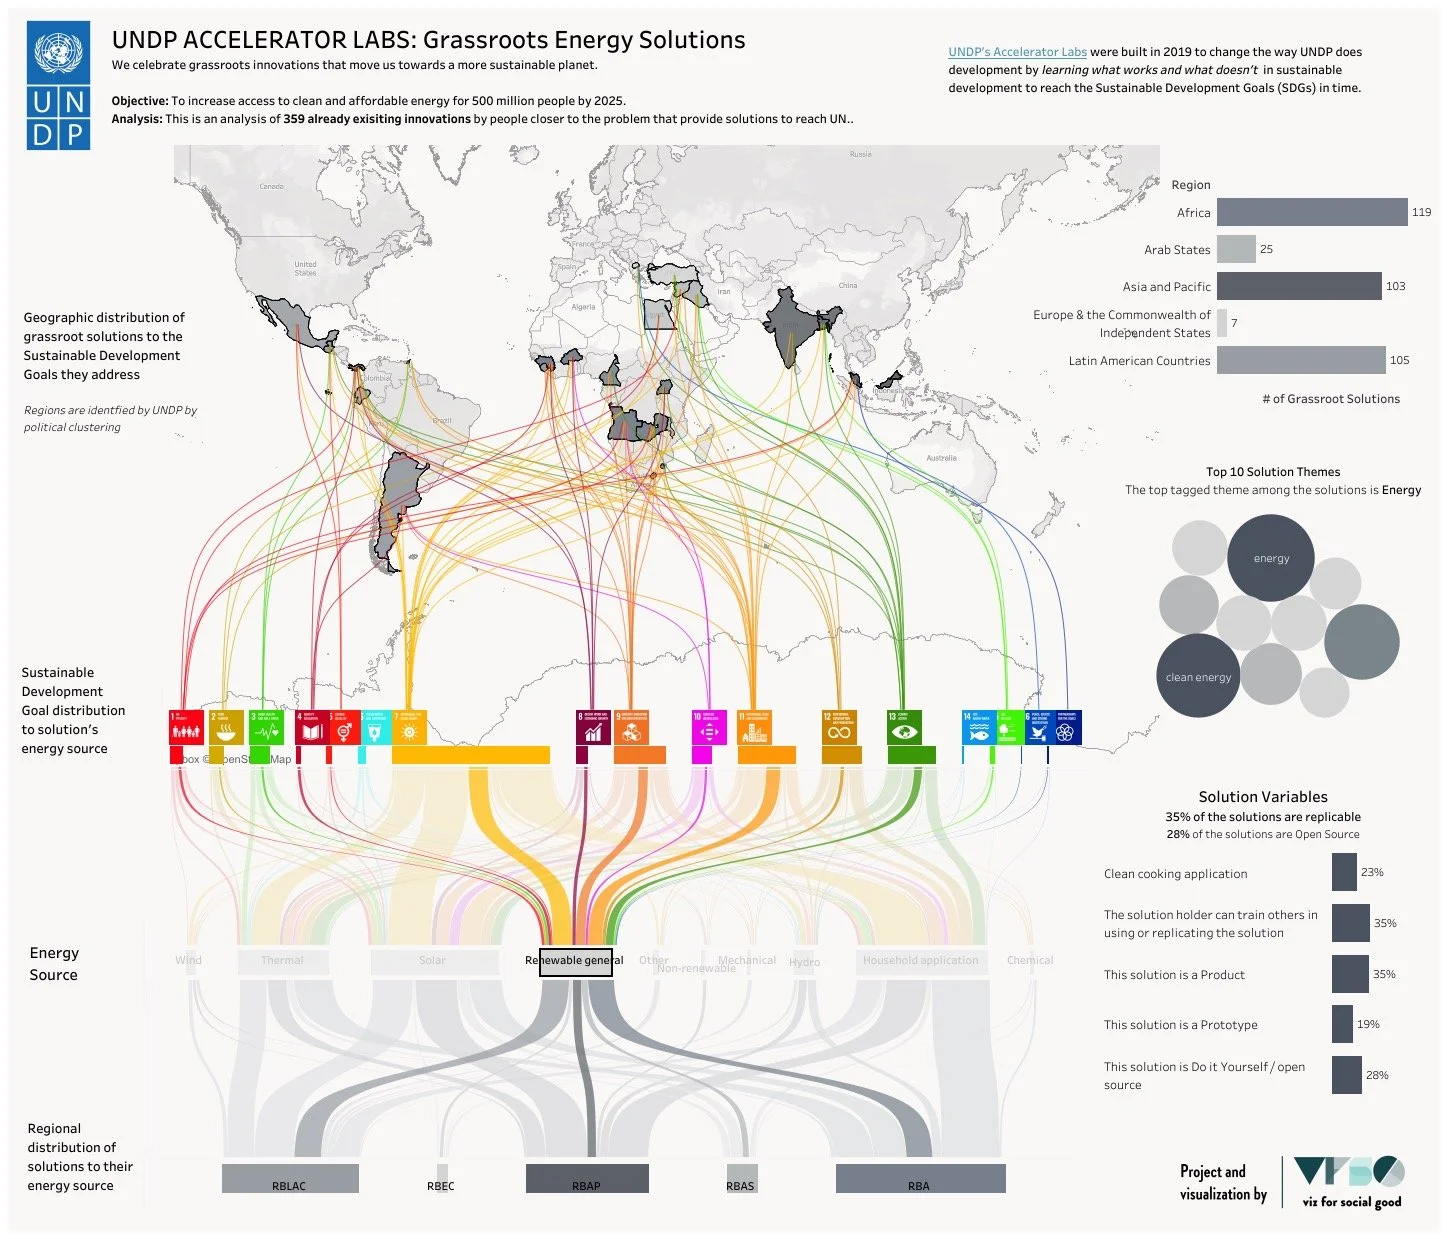
United Nations Development Programme

Over four months, a team identified 359 grassroots energy solutions across various regions and demographics, highlighting the importance of local innovation for sustainable development and creating impactful visualizations to advocate for their significant contributions amid global crises and stalled climate negotiations.

Build Up Nepal

Build Up Nepal, an award-winning social enterprise, empowers rural communities by providing safe, affordable housing and resilient incomes, and aims to use impactful data visualizations to communicate their successes and advocate for better housing and infrastructure in rural Nepal to key stakeholders and funders.

What People are saying…

“Sarah was able to not only design and build some incredible graphics, but kept us organized throughout the engagement, helped decipher our complex business requirements, and was a collaborative partner throughout the process.”

Client Feedback, Moser Inc

“Can I just say I'm very very impressed and I also like that Sarah was kind of contacting me a bit during the process and like actively asking for feedback.”

Andreas Kolling, Build Up Nepal

“Sarah used Power BI and rather than going “long form”, set up her dashboard perfectly as a summary with functionality to download in Power Point. We loved this functionality and all the filter capabilities, not to mention the beautiful design”

Viz for Social Good, Sunny Street Project

Sample my Work

How I Can Help You

Let’s chat!

About Me


Hi there! I'm Sarah, a data enthusiast with over a decade of globetrotting experience across industries like healthcare, cybersecurity, higher education, government, and finance. Currently, I’m rocking the role of Principal Data Visualization Engineer and Technology Leader at Moser, Inc., where I blend creativity with complex data to uncover meaningful insights.

At work, you'll find me leading the DataViz Technology Interest Group and actively engaging with the broader data visualization community. I’m passionate about connecting the dots between human experiences and data, helping individuals and organizations make informed decisions.

When I'm not crunching numbers, I'm out exploring the great outdoors, traveling to new places, sipping on endless cups of coffee, diving into captivating stories, and making meaningful connections with awesome people.

Lover of Data | Outdoor Enthusiast | Creator | Adventurer | Global Traveler

With a diverse background in finance and international operations, I bring a unique skill set to the table. My love for continuous learning and adventure keeps my creativity and curiosity alive, enriching my global perspective. This blend of experiences has empowered leaders to make precise and informed decisions across various cultures, economies, and industries.

Other Roles:

  • Data Changemakers- Board of Directors Member (2025 - present)

  • Colorado Mountain Club- Member (2024 - present)

  • Women in Data- Member and Speaker (2024 - present)

  • Viz for Social Good- Director of Fundraising, Board Member (2024 - 2025)

  • Central Indiana Wilderness Club, Board Member (2022 - 2023)

  • Photographer, learner, storyteller, and world traveler (forever)