Sunny Street
Mobile Outreach Healthcare Unit
Mission
To facilitate community connectivity and improve access to healthcare options for homeless and vulnerable individuals in Australia.
Background
With nearly three years of data available, Sunny Street aims to understand the evolving nature of their services, particularly considering the impact of COVID-19. They seek insights into service uptake patterns, changes in patient demographics, and the health economics of their operations, including their impact on emergency department presentations and access to mental health services. Furthermore, they aim to articulate their social impact to stakeholders and potential sponsors.
My approach
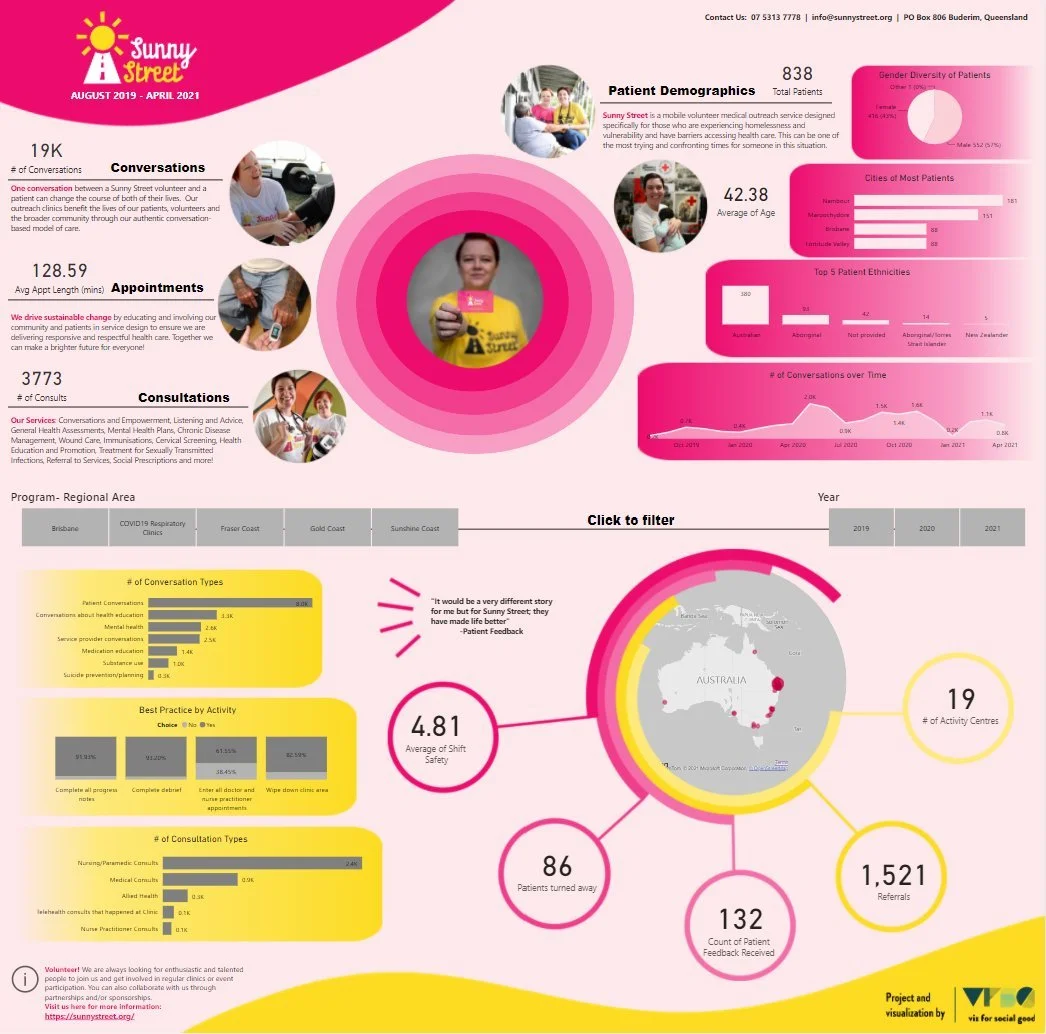
I conducted an analysis of Sunny Street’s data and researched their organization’s objectives. Through story finding and discovery, I identified key insights and data points aligning with their narrative. Utilizing tools like Power BI and Canva, I crafted visualizations and dashboards, iterating designs to personalize the data story with Sunny Street’s branding and imagery. Subsequently, I presented the work to Sunny Street’s team, incorporating their feedback and suggestions.
How it was used
Sunny Street plans to leverage the visual representation of their service data to secure grants, contracts with hospitals and health services, and engage with Primary Health Networks. They aim to disseminate these visualizations across print, websites, and social media platforms to reach various stakeholders, including government bodies, philanthropists, corporate sponsors, and the general public.
Feedback & testimonials
Feedback from Sunny Street’s CEO and co-founder, Sonia Martin, emphasized the value of the data stories in demonstrating the organization’s impact. Additionally, the functionality and design of the dashboard, particularly its summarization and filter capabilities, were praised by the organization’s team.
Sarah used Power BI and, rather than going long-form, set up her dashboard perfectly as a summary with functionality to download in PowerPoint. We loved this functionality and all the filter capabilities, not to mention the beautiful design.