Use Cases:
Project Examples
Showcasing project examples that dive into the nitty-gritty of each adventure, covering the organization, mission, background, what was needed, my creative approach, how the results were used, and the awesome feedback or testimonials I received along the way!"
UNDP Accelerator Labs
Organization: UNDP Accelerator Labs, established in 2019 by the United Nations Development Programme (UNDP), aim to revolutionize development practices to achieve the Sustainable Development Goals (SDGs) in a rapidly changing world.
Location: Global
Project: Viz for Social Good
Link: UNDP Website
-
The mission of UNDP Accelerator Labs is to bridge the gap between traditional development methods and the urgent pace of change by identifying and promoting innovative solutions to achieve the SDGs. As part of their strategic plan, they aspire to provide clean and affordable energy to 500 million people by 2025, particularly in crisis contexts and hard-to-reach areas.
-
Over the course of four months, our network of solutions mappers meticulously identified 359 grassroots energy solutions spanning diverse regions, demographics, and energy sources. This intensive effort underscored the need to acknowledge the ingenuity and problem-solving capacity inherent in many communities, which could significantly contribute to UNDP's overarching mission of sustainable development. Recognizing the urgent need for innovative approaches, particularly amidst contemporaneous crises and inertia in inter-governmental climate negotiations, there arose a critical necessity to visually represent the data. We recognized that effective visualization would not only advocate for the importance of local solutions but also highlight their added value and potential contribution to broader development efforts. Consequently, the call to action emerged: to showcase the value of grassroots innovation through clear and impactful visualizations, thereby advocating for a more sustainable future.
-
I began by analyzing their data and delving into the organization's background and objectives. Through this process, I identified key insights and data points that aligned with their narrative. Utilizing tools like Tableau and Tableau Prep, I crafted visualizations that effectively communicated the value of grassroots innovation in sustainable development. Collaborating with Tableau experts, I refined the design and layout of the dashboard, incorporating branding and images to personalize the data story. After presenting my work to the UNDP Accelerator Labs team, I received positive feedback and was subsequently contacted to update the dashboard for publication on their website. This collaborative process ensured that the visualizations effectively advocated for a more sustainable future and resonated with diverse audiences, from government partners to the general public.
-
The visualizations were utilized in a global communication campaign during the 2022 United Nations Climate Change Conference (COP 27) and a #PeoplePowered energy campaign leading up to the event. The audience included government partners, international donors, development practitioners, climate experts, academia, and the general public.
-
Feedback from the UNDP Accelerator Labs team was positive, with the dashboard being deemed effective in showcasing the importance of grassroots innovation in achieving sustainable development goals. The utilization of the visualizations in global communication campaigns further demonstrated their impact and relevance on a broader scale.
Book a 15 minute discovery call to discuss more!
Sunny Street
Organization: Mobile Outreach Healthcare Unit
Location: Australia
Project: Viz for Social Good
Link: Power BI Site
-
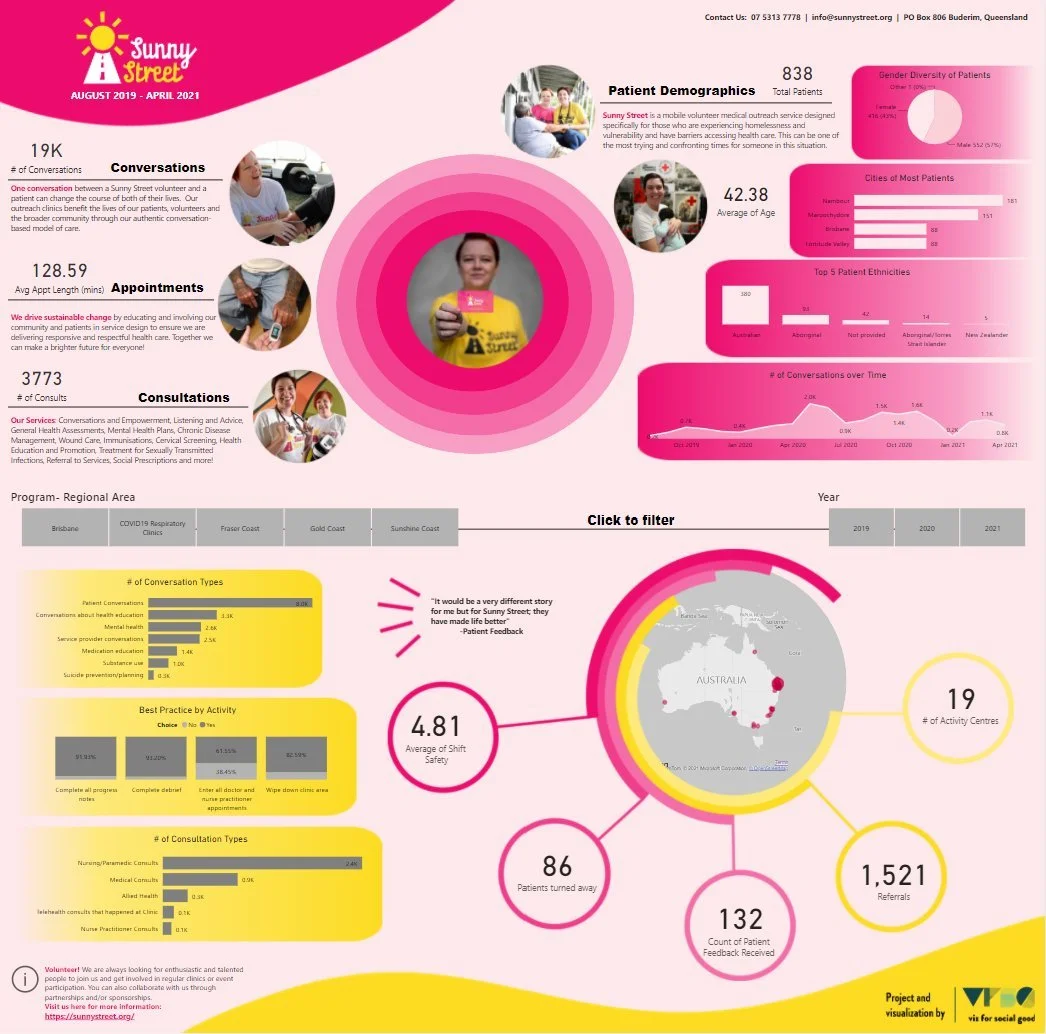
To facilitate community connectivity and improve access to healthcare options for homeless and vulnerable individuals in Australia.
-
With nearly three years of data available, Sunny Street aims to understand the evolving nature of their services, particularly considering the impact of COVID-19. They seek insights into service uptake patterns, changes in patient demographics, and the health economics of their operations, including their impact on emergency department presentations and access to mental health services. Furthermore, they aim to articulate their social impact to stakeholders and potential sponsors.
-
I conducted an analysis of Sunny Street's data and researched their organization's objectives. Through story finding and discovery, I identified key insights and data points aligning with their narrative. Utilizing tools like Power BI and Canva, I crafted visualizations and dashboards, iterating designs to personalize the data story with Sunny Street's branding and imagery. Subsequently, I presented the work to Sunny Street's team, incorporating their feedback and suggestions.
-
Sunny Street plans to leverage the visual representation of their service data to secure grants, contracts with hospitals and health services, and engage with Primary Health Networks. They aim to disseminate these visualizations across print, websites, and social media platforms to reach various stakeholders, including government bodies, philanthropists, corporate sponsors, and the general public.
-
Feedback from Sunny Street's CEO and co-founder, Sonia Martin, emphasized the value of the data stories in demonstrating the organization's impact. Additionally, the functionality and design of the dashboard, particularly its summarization and filter capabilities, were praised by the organization's team.
Book a 15 minute discovery call to discuss more!
Build Up Nepal
Organization: Build Up Nepal is an award-winning social enterprise dedicated to empowering rural entrepreneurs and communities in Nepal. Their mission is to break the cycle of poverty by providing safe, affordable homes and resilient incomes.
Location: Nepal
Project: Viz for Social Good
Link: Build Up Nepal Website
Link: Power BI Site
-
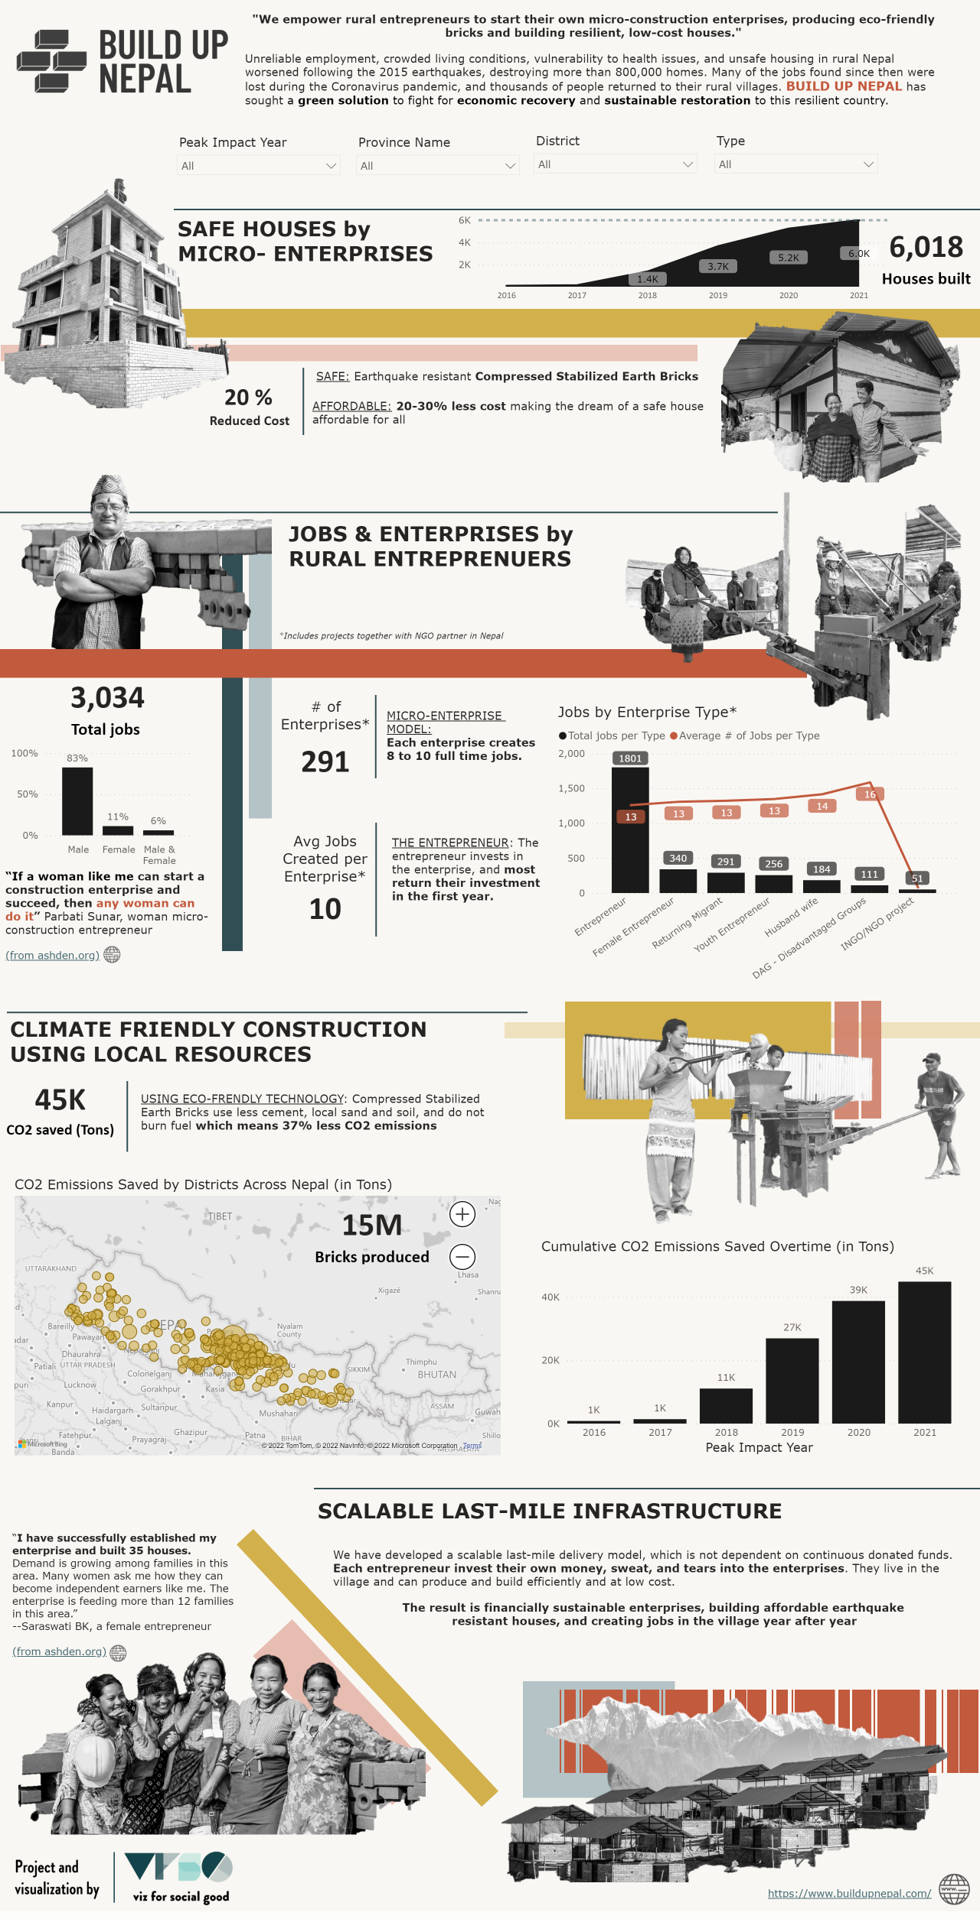
Build Up Nepal aims to transform Nepal's construction sector and alleviate poverty by facilitating the production of eco-friendly bricks and constructing disaster-resilient homes. Their goal is to replace 10% of Nepal's fired bricks by 2030, thereby contributing to a greener, safer, and more sustainable future.
-
In Nepal, many marginalized families aspire to live in safe brick houses but struggle due to financial constraints. Moreover, the traditional fired brick industry poses environmental challenges. Following the 2015 earthquakes and exacerbated by the COVID-19 pandemic, rural communities faced unreliable employment, crowded living conditions, and unsafe housing. Build Up Nepal seeks to address these issues by providing a green solution for economic recovery and sustainable restoration.
-
I analyzed Build Up Nepal's data and delved into their organization's objectives. Through research and story discovery, I identified key insights that resonated with their narrative. Utilizing tools like Power BI and Excel, I crafted visualizations and designed a dashboard that effectively communicated their impact. Collaborating closely with stakeholders, including Andreas, I iterated through design and layout, incorporating branding and images to personalize the data story. The result was a dynamic visualization that offered both a quick overview and in-depth exploration of Build Up Nepal's impact.I analyzed Build Up Nepal's data and delved into their organization's objectives. Through research and story discovery, I identified key insights that resonated with their narrative. Utilizing tools like Power BI and Excel, I crafted visualizations and designed a dashboard that effectively communicated their impact. Collaborating closely with stakeholders, including Andreas, I iterated through design and layout, incorporating branding and images to personalize the data story. The result was a dynamic visualization that offered both a quick overview and in-depth exploration of Build Up Nepal's impact.
-
The visualizations created will enable Build Up Nepal to communicate their impact to key stakeholders, including communities, government partners, and funders. They will be utilized across various platforms such as websites, social media, annual reports, and grant applications to elevate conversations about safe, hygienic housing in rural areas and the importance of prioritizing last-mile infrastructure in development plans.
-
I'm very impressed, and I also like that Sarah was actively asking for feedback. I almost felt like I co-created it just a tiny bit at least. The highlight of this creation is that on the first glance, you really get the quick data, but then you could sit for an hour and look through what happened over in each section. It really shows that the earthquake was mainly in the center of Nepal. I loved how the map showed year by year how it grew across the country. There was a lot of data, but you don't get overwhelmed in the beginning. It was really well made. Thanks a lot, Sarah."
—Andre Kolling,
Book a 15 minute discovery call to discuss more!
Bridges to Prosperity
Organization: Bridges to Prosperity (B2P) works with isolated communities to build trail bridges over impassable rivers, and create lasting connections to essential services and opportunities.
Location: Global
Project: Viz for Social Good
Link: Tableau Site
-
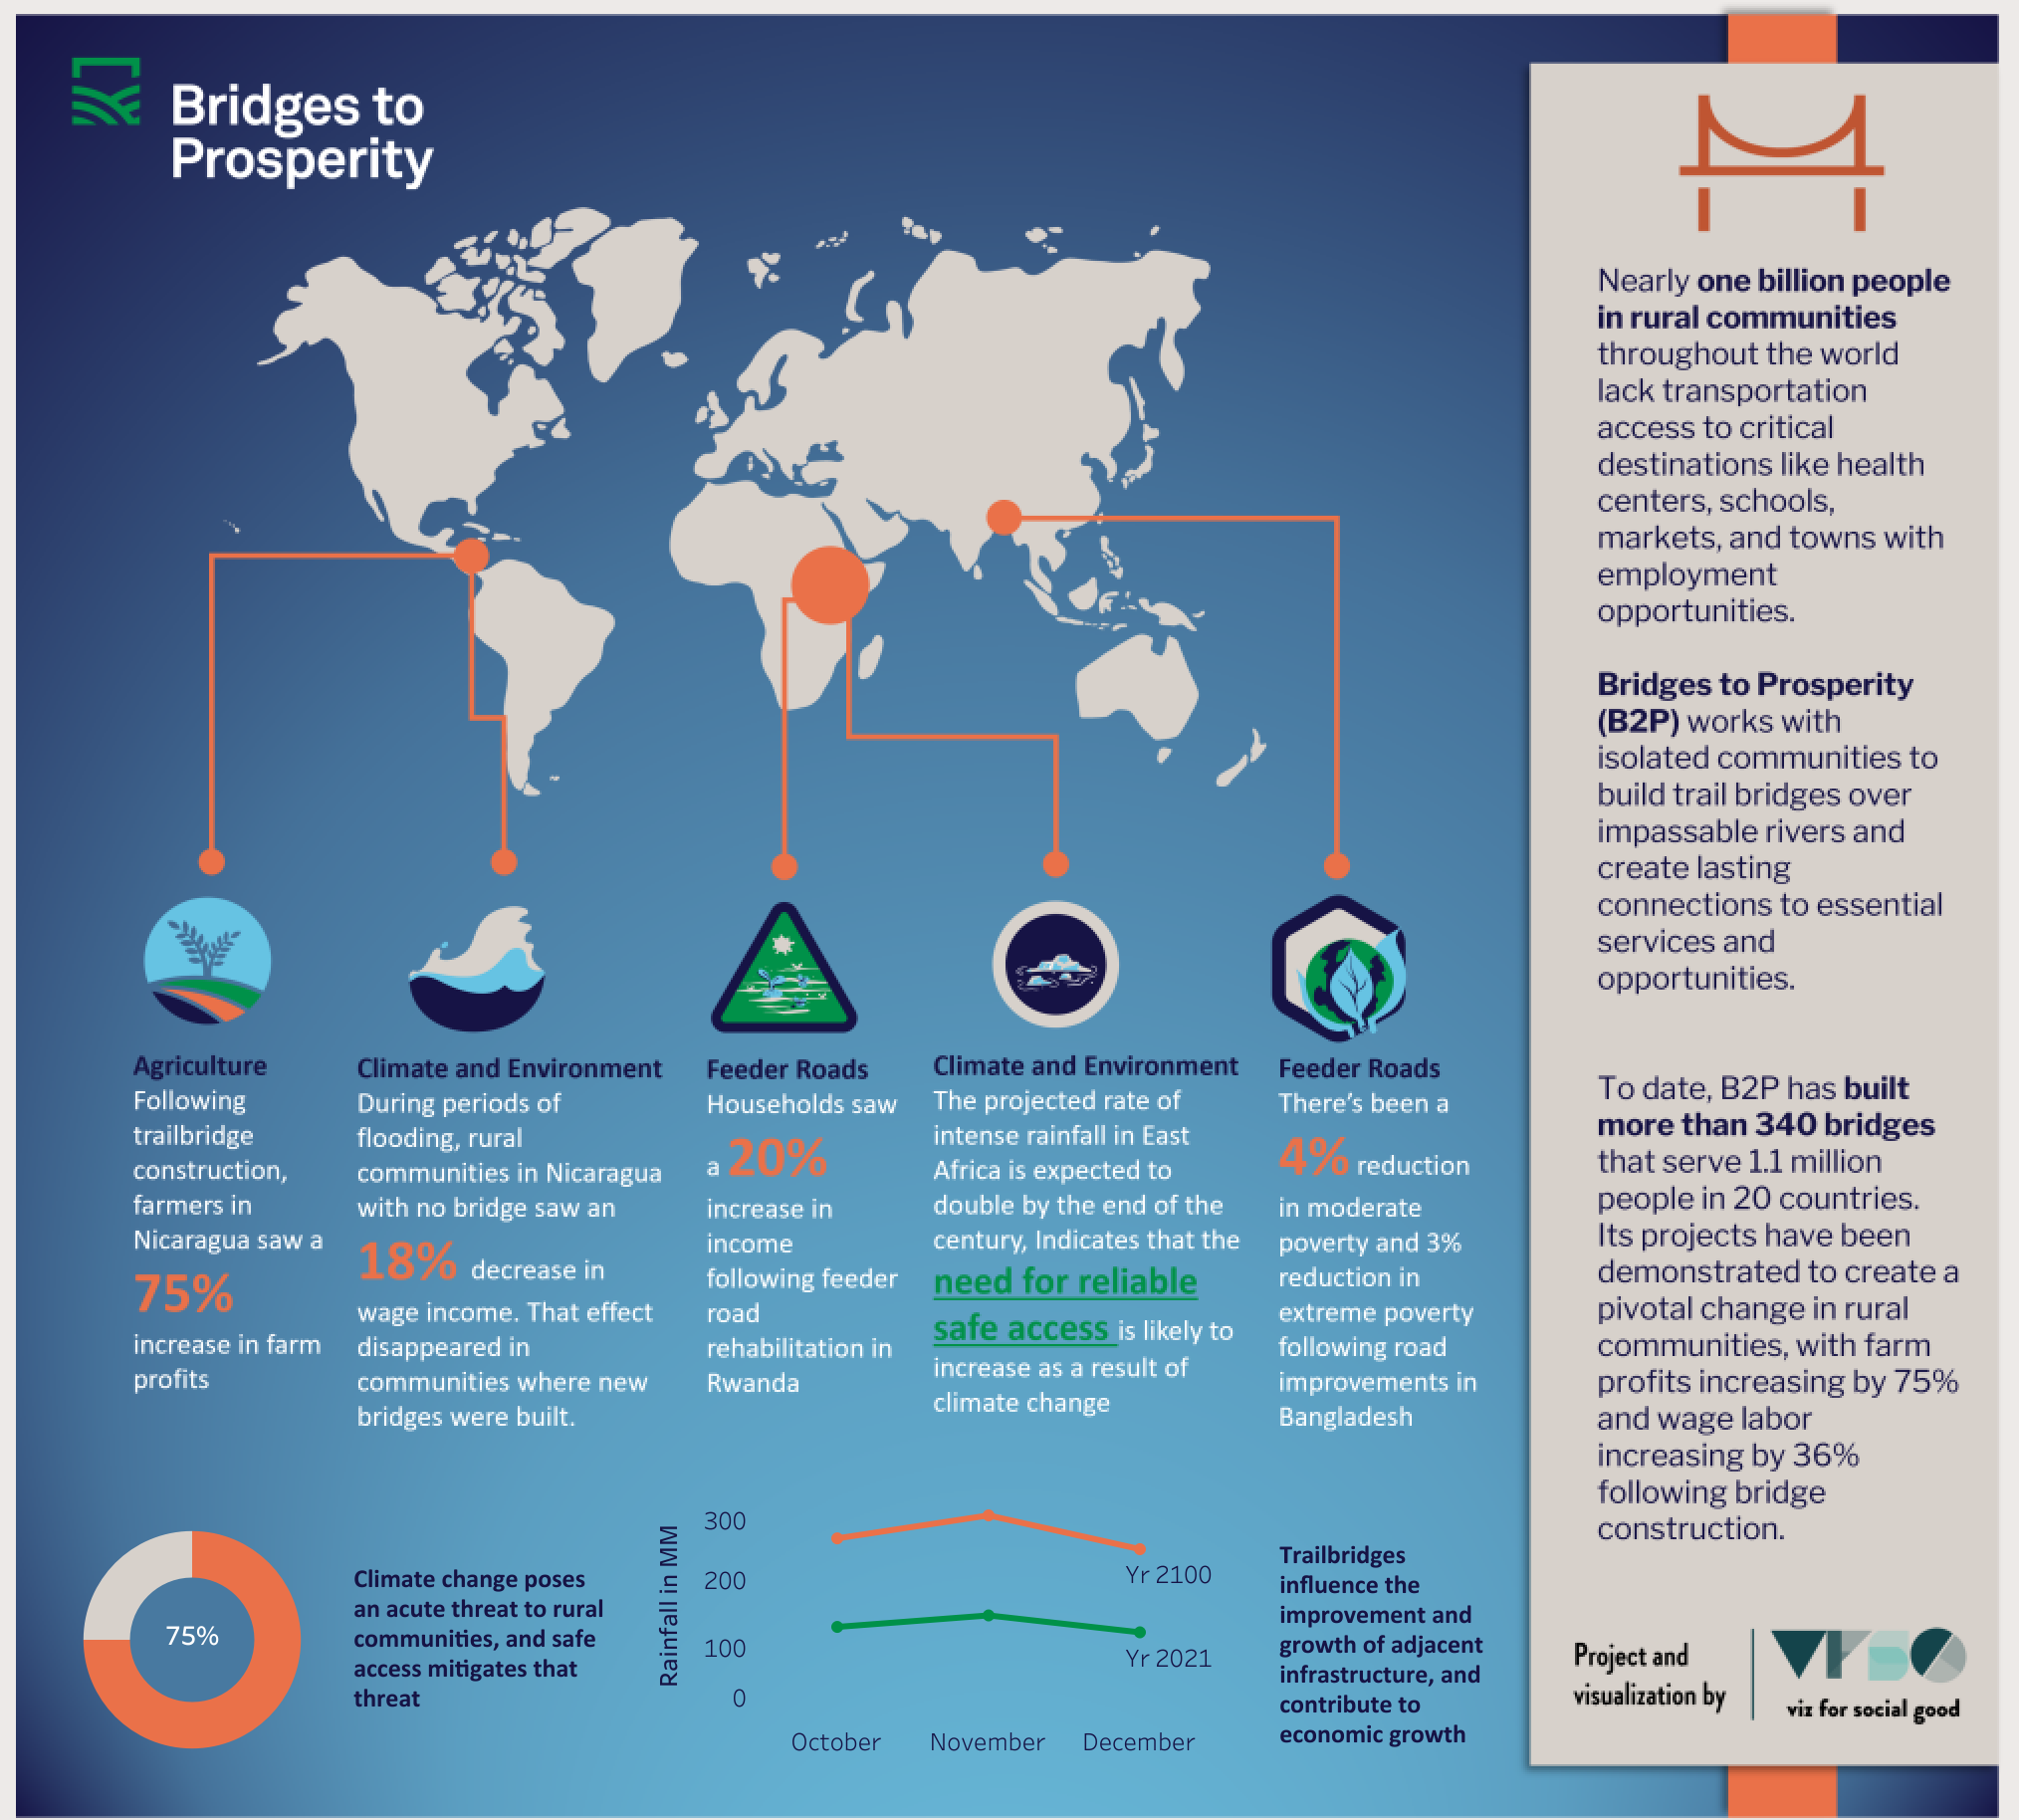
B2P's mission is to build bridges to better lives in rural communities, ultimately striving for a future where poverty caused by rural isolation no longer exists.
-
Rural isolation perpetuates poverty, hindering access to vital services and opportunities. B2P responds by creating rural access briefs to highlight the significance of safe access in rural areas. These briefs serve as engaging summaries of how trail bridges and other rural transportation infrastructure can catalyze significant change. You can contribute to solving the problem of rural isolation by donating or sharing these findings with your network.
-
I crafted an infographic using Tableau to visualize B2P's impact, illustrating how trail bridges connect isolated communities to essential services. My work was recognized with a Community Award, showcasing the effectiveness of the visualizations. Utilizing tools such as PowerPoint, Excel, Tableau, and Tableau Prep, I ensured the dashboards were suitable for both print and digital formats, as requested by B2P.
-
The rural access briefs and dashboards are used as print and digital collateral to engage strategic partners and stakeholders, including national governments and funding agencies. By disseminating this information, B2P aims to garner support and funding for their initiatives.
-
My viz was chosen for the community award for this project, and I was invited to speak at a Tableau User Group after the leader saw my visualization online
Book a 15 minute discovery call to discuss more!
Space Exploration,Viz2Educate
Organization: #Viz2educate is dedicated to creating a high-quality bank of educational resources for teachers worldwide, providing free access to subject-related visualizations
Location: Global
Project: Viz2Educate: History
Link: Tableau Site
-
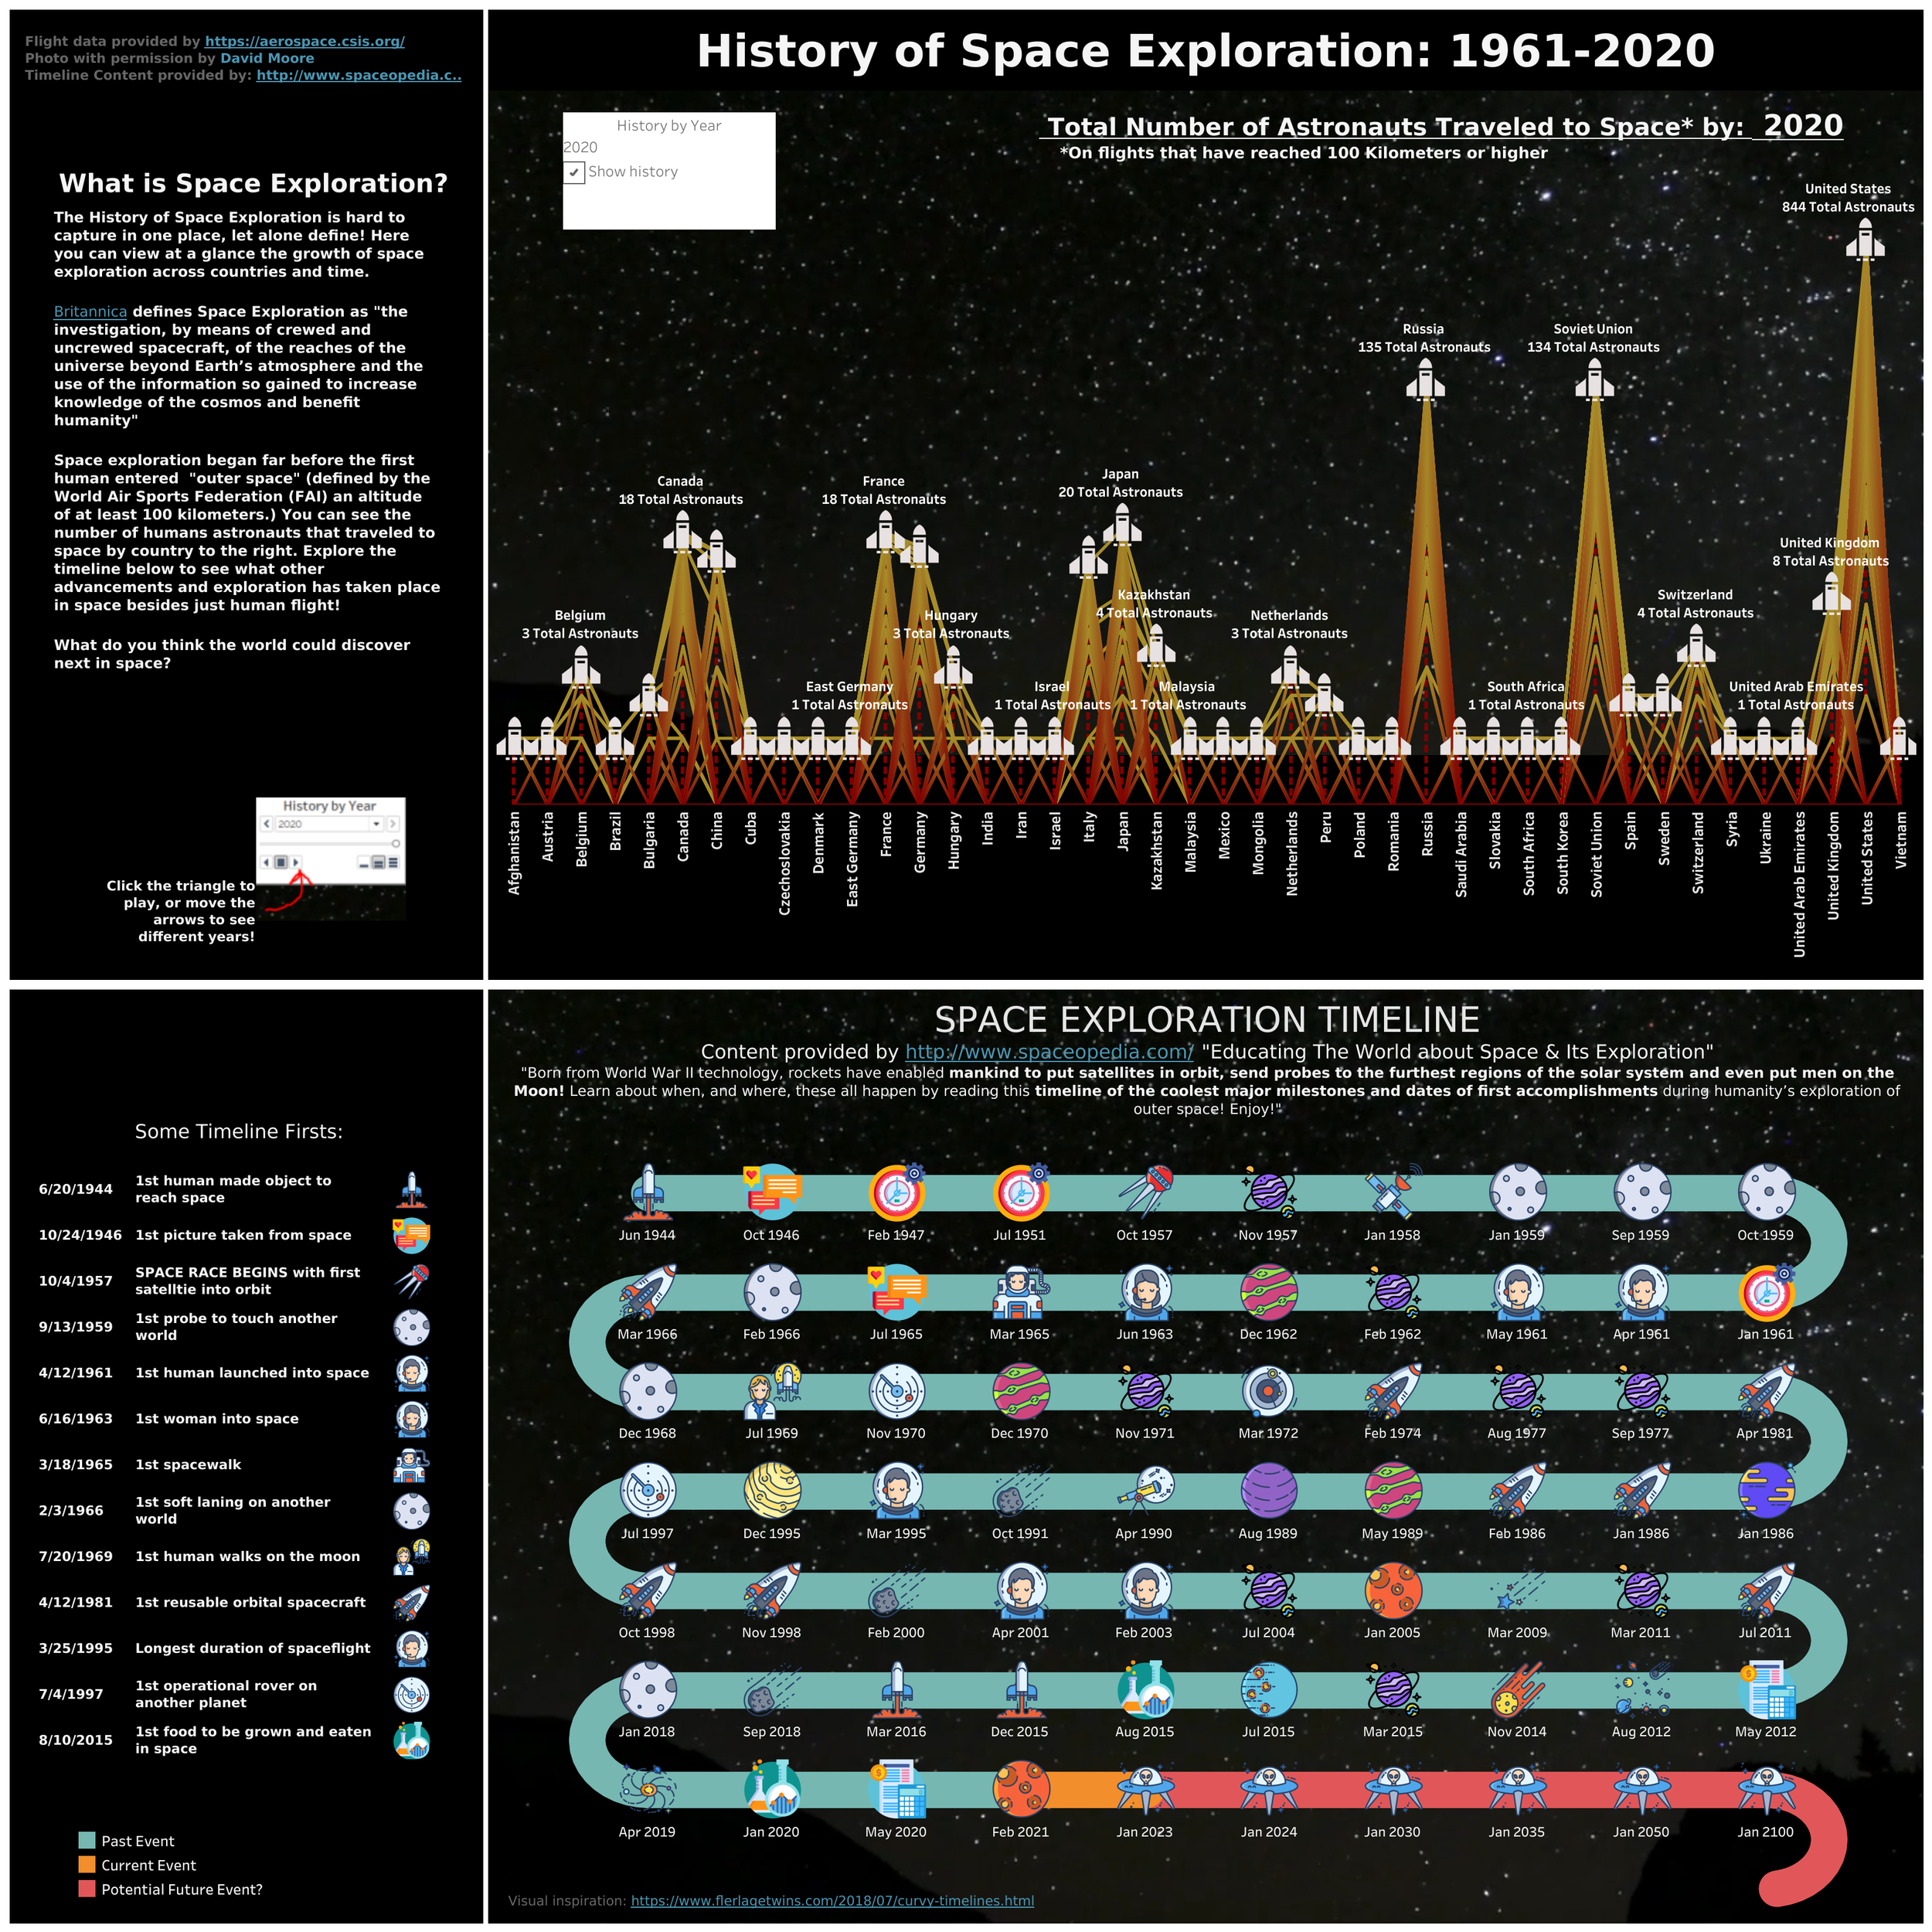
#Viz2educate aims to empower teachers and students globally by offering free access to educational resources, fostering engagement with data visualization, and instigating a passion for learning.
-
Each country has its own unique history curriculum, making it essential to provide a wide range of history topics for educators worldwide. #Viz2educate focuses on addressing this need by curating educational resources on various subjects, including history, science, and geography. As part of their mission, they encourage contributions from the #Datafam community to enrich the available resources. You can contribute by sharing your expertise or accessing the educational gallery to enhance your teaching materials.
-
I chose the global topic of the history of space exploration and curated educational resources in two parts: astronauts who went to space by country and year, and a timeline of major space exploration events. To ensure accuracy and engagement, I explored and refined data from reputable sources such as Aerospace and Spaceopedia. Additionally, I incorporated a fun, interactive retro game-like theme to make the visualizations engaging for educators and students. I sought feedback from a Data Viz expert to refine the design, particularly focusing on the curved timeline aspect.
-
The visualizations created by #Viz2educate serve as an online gallery of educational resources for teachers and students globally. They not only provide unlimited access to resources but also inspire the next generation to engage with data visualization. The gallery covers various subjects based on a curated global syllabus, ensuring relevance and applicability across diverse educational contexts.
-
"Our gallery will be a one-stop-shop for subjects like geography, history, science, etc. The visualizations will be based on a curated global syllabus post discussion with teachers from around the globe." - #Viz2educate
Book a 15 minute discovery call to discuss more!


